Troubleshooting Handle Leak Issue
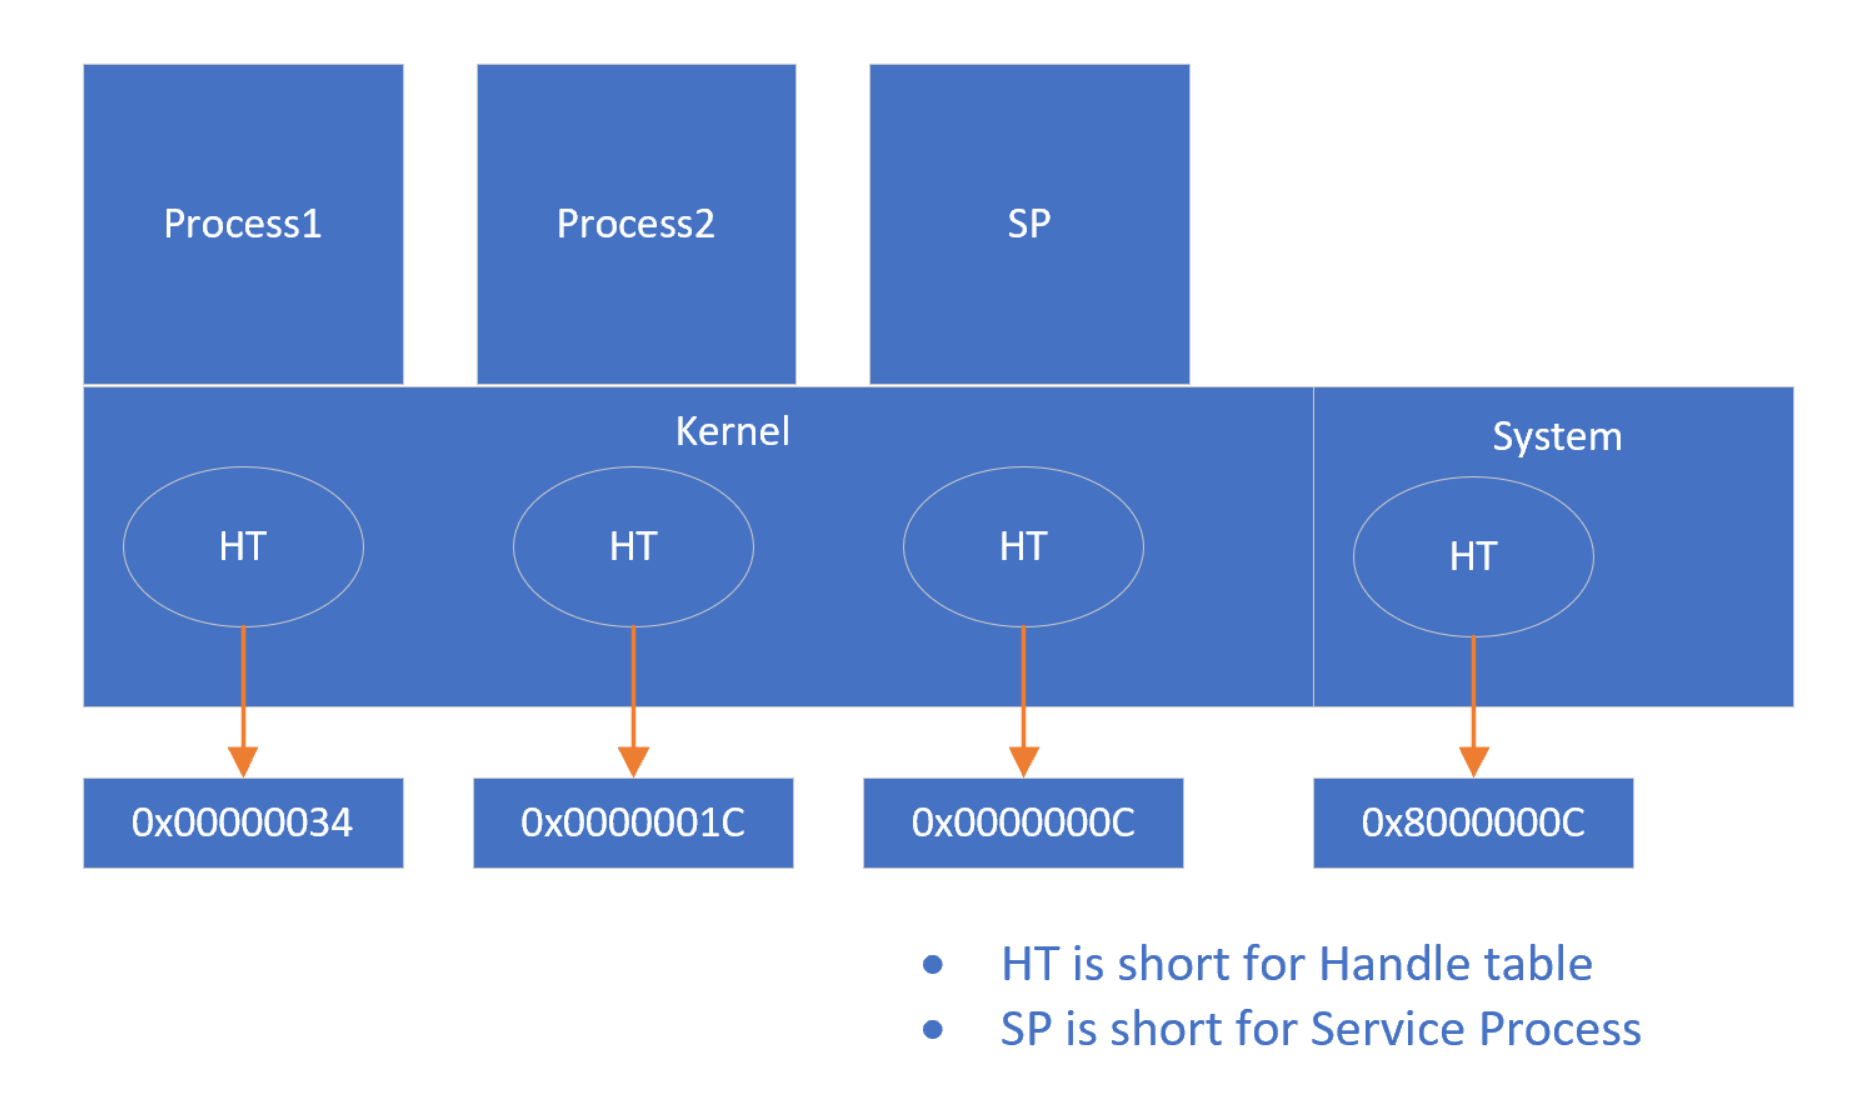
Every process has its own handle table in kernel base. And system handle table stores handles shared by the system process which will set high bit.
Handle Table Structure

Usually We can use WPR to record the handle usage in system and WPA to annalyze it. Below is the genral steps to record and analysze steps.
Use Windows Performace Tool Kit to Truoubleshoot a Handle Leak Issue in System Above Windows 8.1
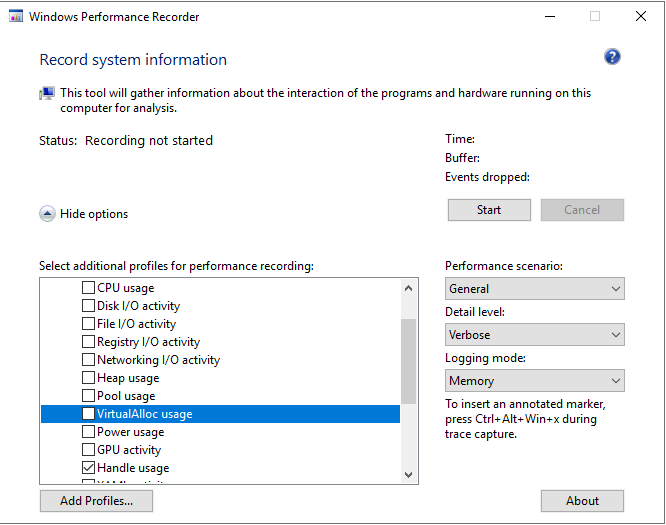
Use WPRUI to Collect Handle Usage
-
Download and install Windows Performance Tool Kit with setup ADK
-
Run Windows Performace Recorder and select “Handle Usage”, Change the logging mode to File,then click Start;

-
Reproduce the issue;
-
After the issue reproduced, Click Save
Use WPR to Collect Handle Usage
-
Save below script to HandleUsage.bat;
wpr -start Handle -filemode REM Start to reproduce your issue REM After reproduce the issue,click any key to stop and save the trace. pause wpr -stop C:\temp\Handle.etl -
Run the script and reproduce the issue;
-
After the issue reproduced, click any key to stop and save the trace;
One of the limitations with WPRUI and WPR are that you cannot collect circular logging. If the issue will takes more than hours to reproduce, please use Xperf instead.
Use Xperf to Collect Handle Usage
-
Save below script to HandleUsage.bat;
REM Change folder to where the “Windows Performance Toolkit” is installed. cd /d "c:\Program Files (x86)\Windows Kits\10\Windows Performance Toolkit" xperf -on Proc_Thread+Loader+Latency+DISPATCHER+ob_handle+ob_object -stackwalk CSwitch+ReadyThread+ThreadCreate+Profile+handlecreate+handleclose -BufferSize 1024 -MinBuffers 1410 -MaxBuffers 4096 -MaxFile 8192 -FileMode Circular -f e:\temp\kernel.etl REM Note – Where E: is the drive where you have 8 GB+ of free disk space. REM Start to reproduce your issue REM After reproduce the issue,click any key to stop and save the trace. pause xperf.exe -d c:\temp\%computername%_HandleLeak.etl -
Run the script and reproduce the issue;
-
After the issue reproduced, click any key to stop and save the trace;
Use WPA to Analyze Handle Usage
-
Double click the ETL trace file and Add below colum on the left of Golden bar;
- Closing Process
- Owning Process
- Handle Type
- Creating Process
- Create Stack
Keep an eye on the order.
-
Select “File -> Configure Symbol Paths -> Add your private symbol folder or server” and then check “Load Symbol”;
-
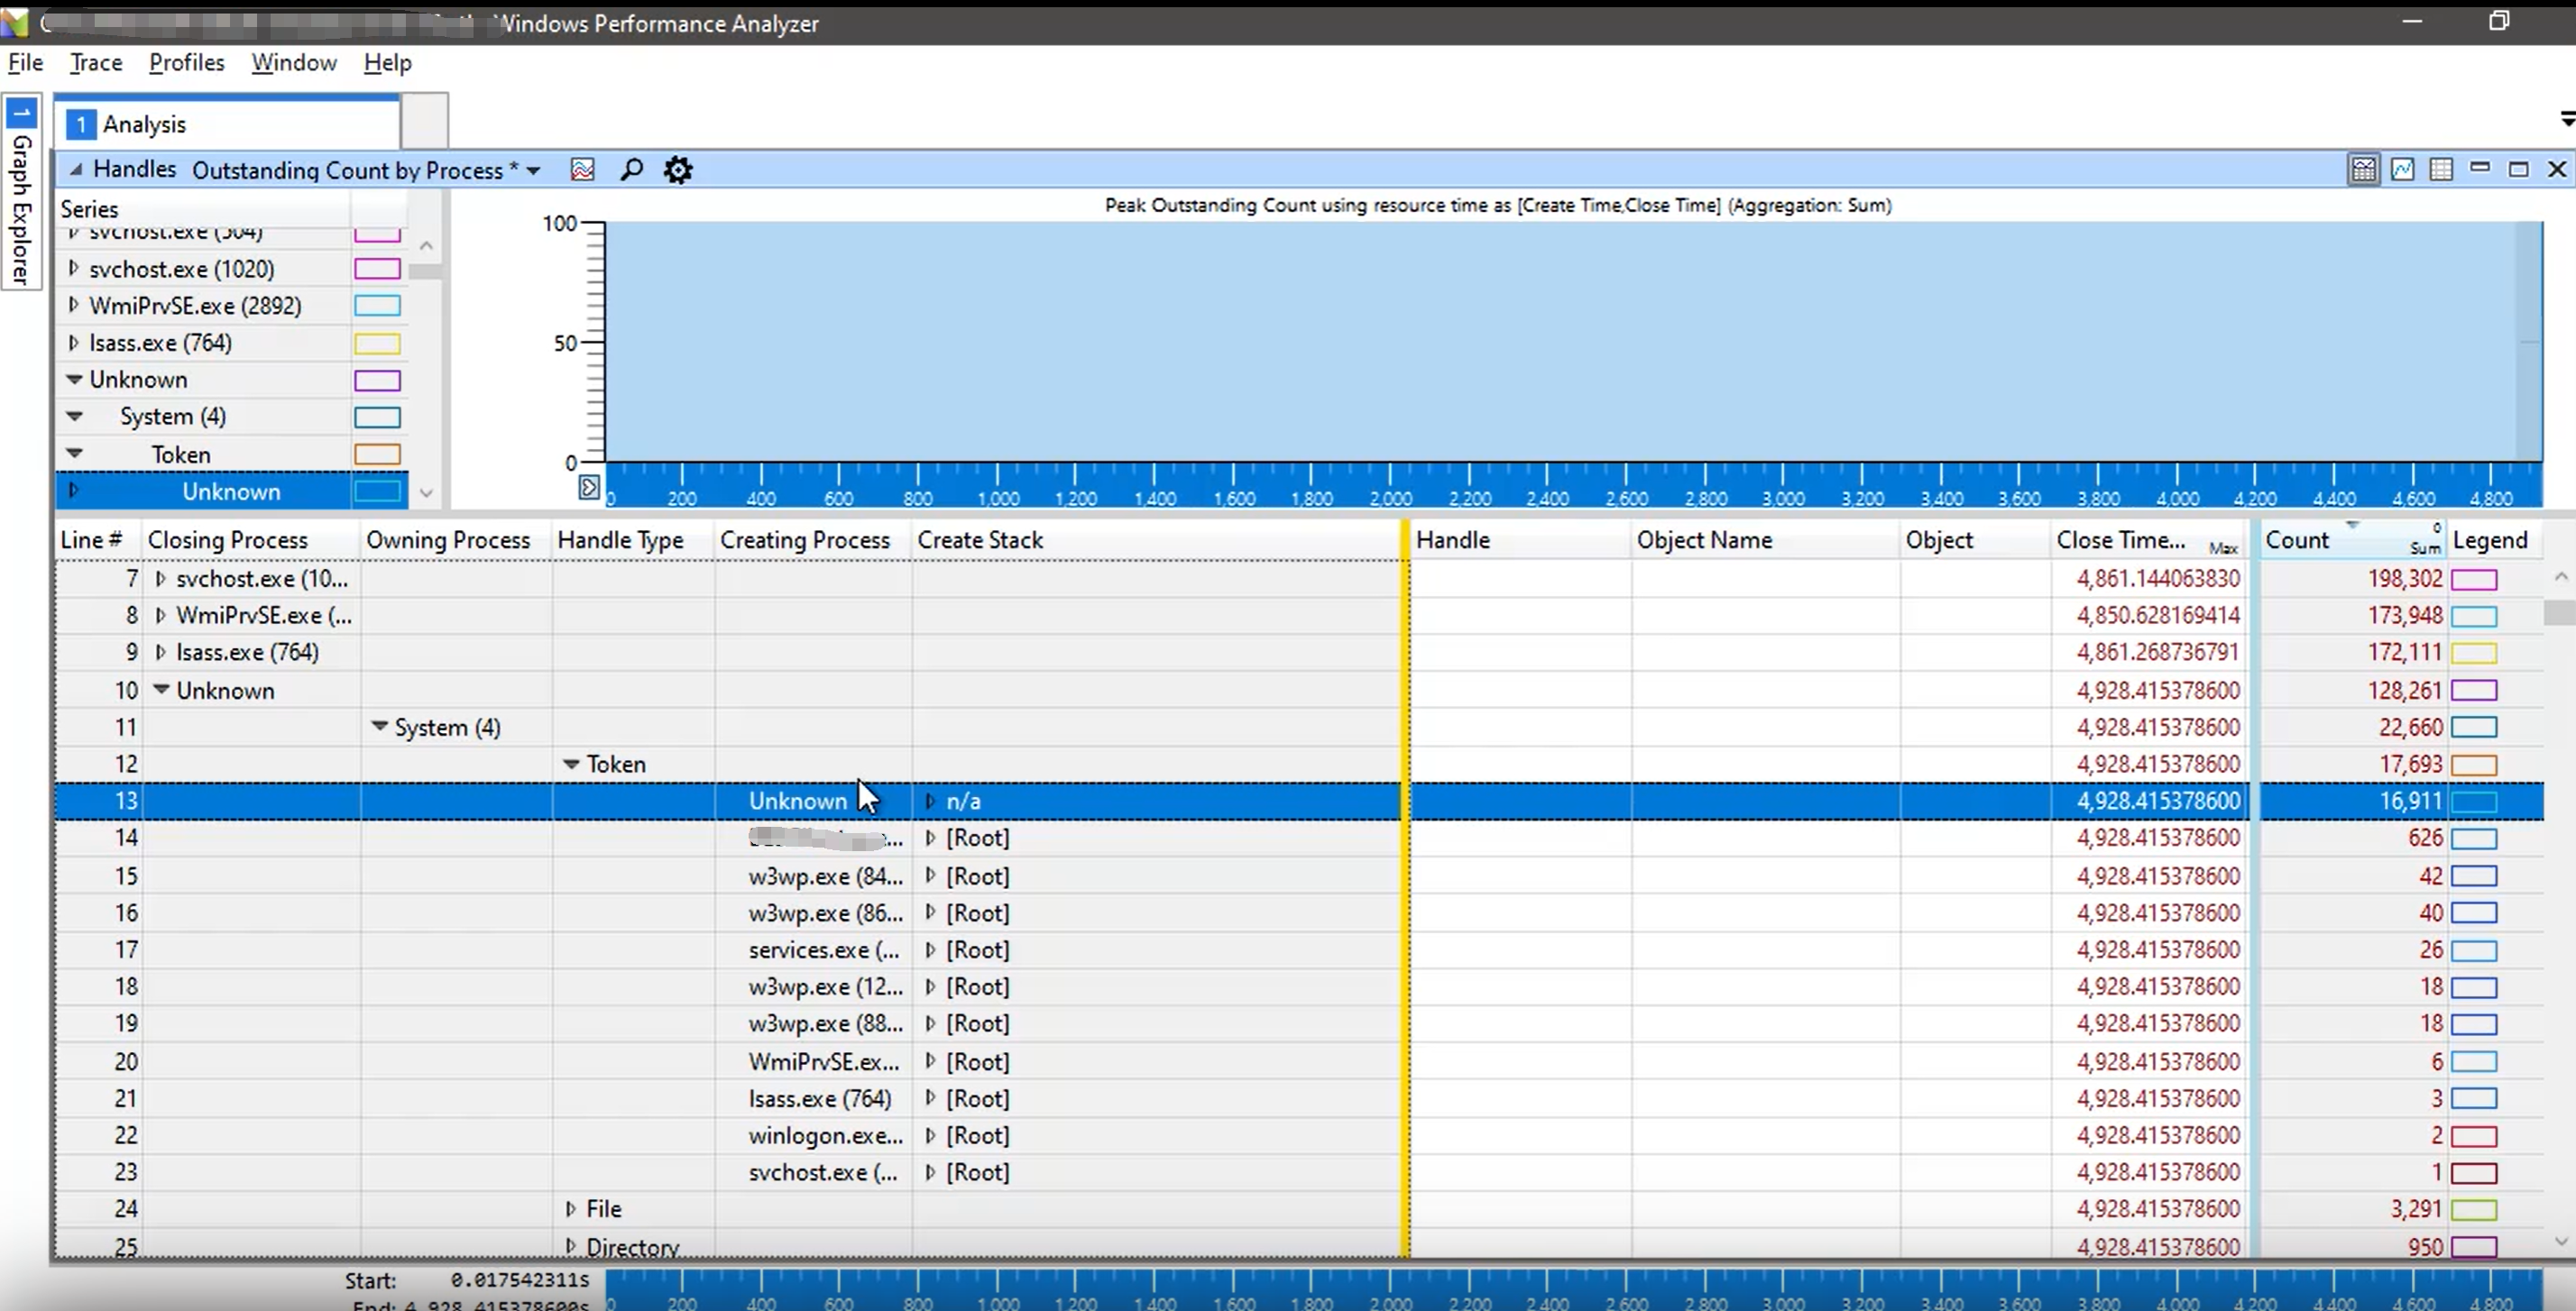
Add “Memory -> Handles OutStanding Count by Process” to your analysis view;hj
-
Focus on the “Closing Process” is Unknown. Then check the “Owning Process” is your application.
-
Think about it why “Closing Process “ is Unknown means Handle Leak. “Closing Process” Unknown means that these handles are not free before we stoped collecting trace.
-
“Creating Process” Unknown means that these handles are already there before we collecting trace.

-
文档信息
- 本文作者:Robin Chen
- 本文链接:https://crushonme.github.io/2020/04/26/Troubleshoot-Handle-Leak/
- 版权声明:自由转载-非商用-非衍生-保持署名(创意共享4.0许可证)
Document Information
- Author :Robin Chen
- Link : https://crushonme.github.io/2020/04/26/Troubleshoot-Handle-Leak/
- Copyright:Attribution-NonCommercial-NoDerivatives-No additional restrictions(CC BY-NC-ND 4.0)
